Datei:Aurora 2015-03-18 TLS.png: Unterschied zwischen den Versionen
Zur Navigation springen
Zur Suche springen
(Lightmeter detection of the Aurora observed in northern Germany on 2015-03-18 by many observers. A proxy for the horizontal illuminance is show as function of time [UTC]. The red and blue curves are for the two lightmeters with a raw calibration. The entire night is shown in the range below 3 mlx. The Auroral signal is visible as a triangular bump near 23:00 UTC. Graph: G. Wuchterl) |
(kein Unterschied)
|
Aktuelle Version vom 26. August 2023, 23:17 Uhr
Beschreibung
Lightmeter detection of the Aurora observed in northern Germany on 2015-03-18 by many observers. A proxy for the horizontal illuminance is show as function of time [UTC]. The red and blue curves are for the two lightmeters with a raw calibration. The entire night is shown in the range below 3 mlx. The Auroral signal is visible as a triangular bump near 23:00 UTC. Graph: G. Wuchterl
Dateiversionen
Klicke auf einen Zeitpunkt, um diese Version zu laden.
| Version vom | Vorschaubild | Maße | Benutzer | Kommentar | |
|---|---|---|---|---|---|
| aktuell | 23:17, 26. Aug. 2023 | 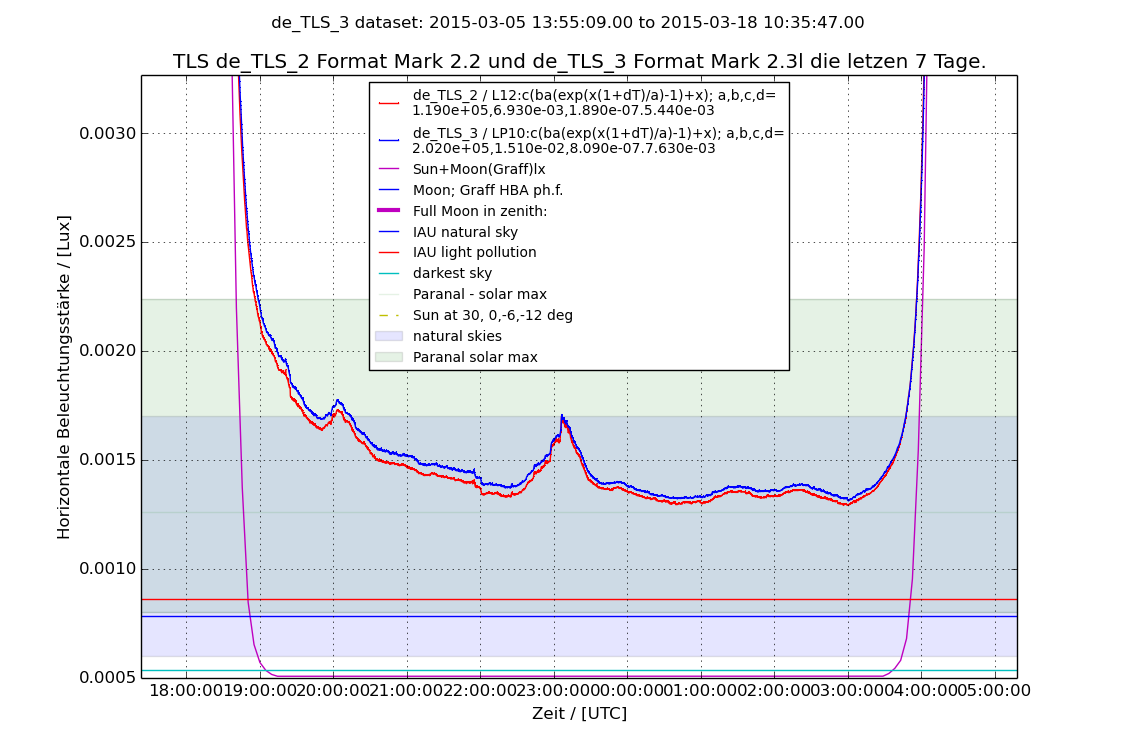 | 1.130 × 753 (129 KB) | GuentherWuchterl (Diskussion | Beiträge) | Lightmeter detection of the Aurora observed in northern Germany on 2015-03-18 by many observers. A proxy for the horizontal illuminance is show as function of time [UTC]. The red and blue curves are for the two lightmeters with a raw calibration. The entire night is shown in the range below 3 mlx. The Auroral signal is visible as a triangular bump near 23:00 UTC. Graph: G. Wuchterl |
Du kannst diese Datei nicht überschreiben.
Dateiverwendung
Die folgende Seite verwendet diese Datei: